Valid Responses
37
Mean Loyalty Index
3.89
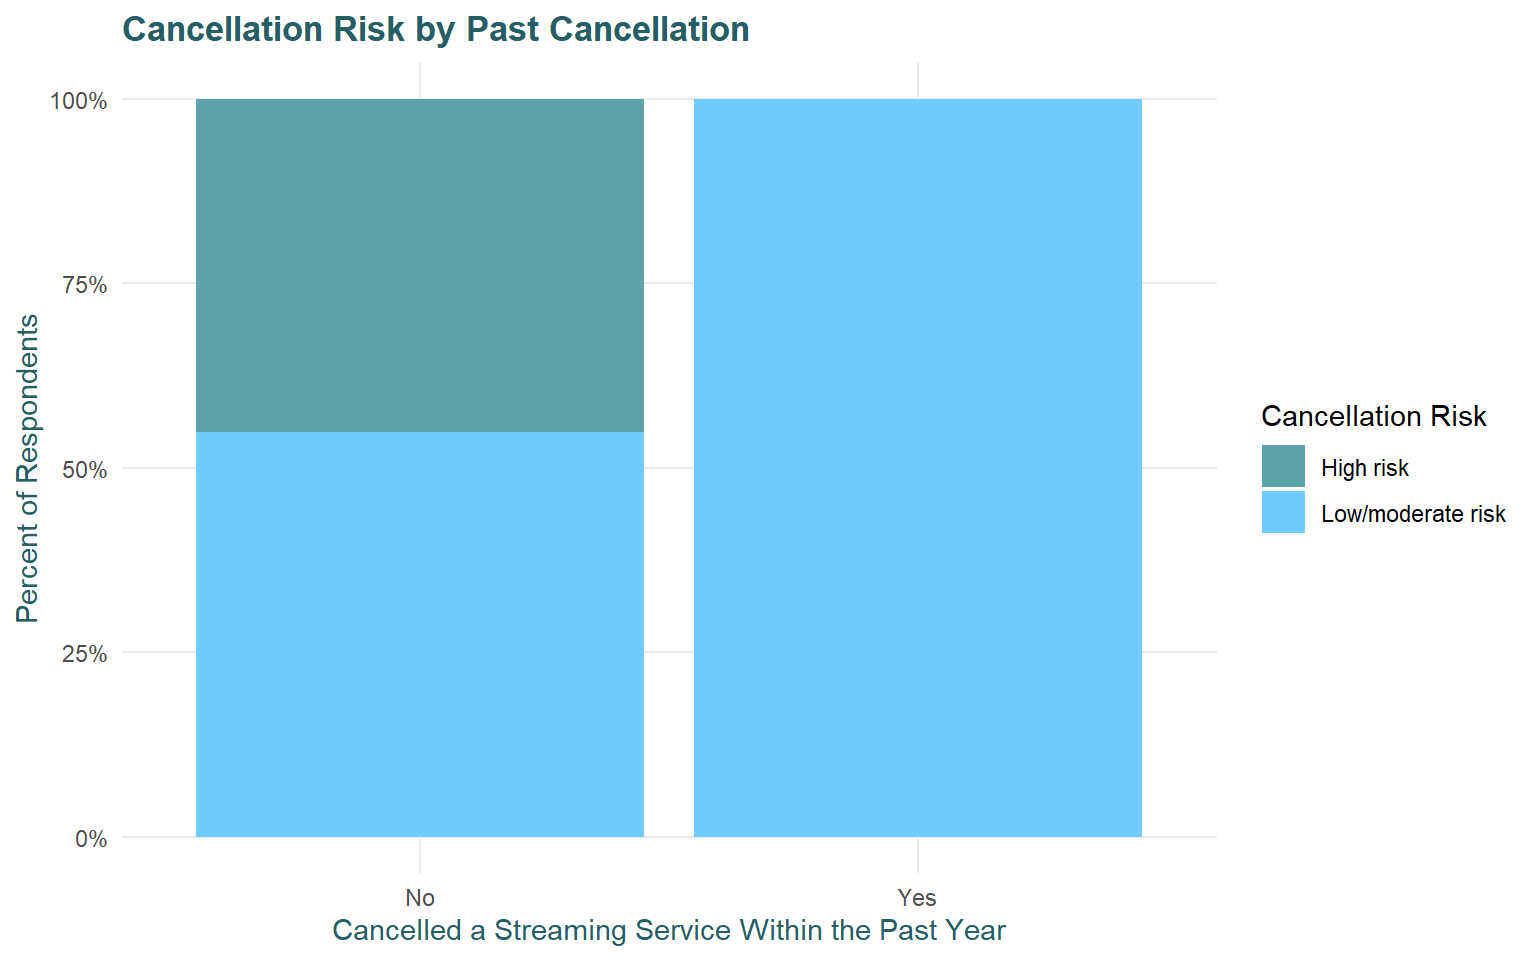
High Cancellation Risk
38%
Cancelled Last Year
16%
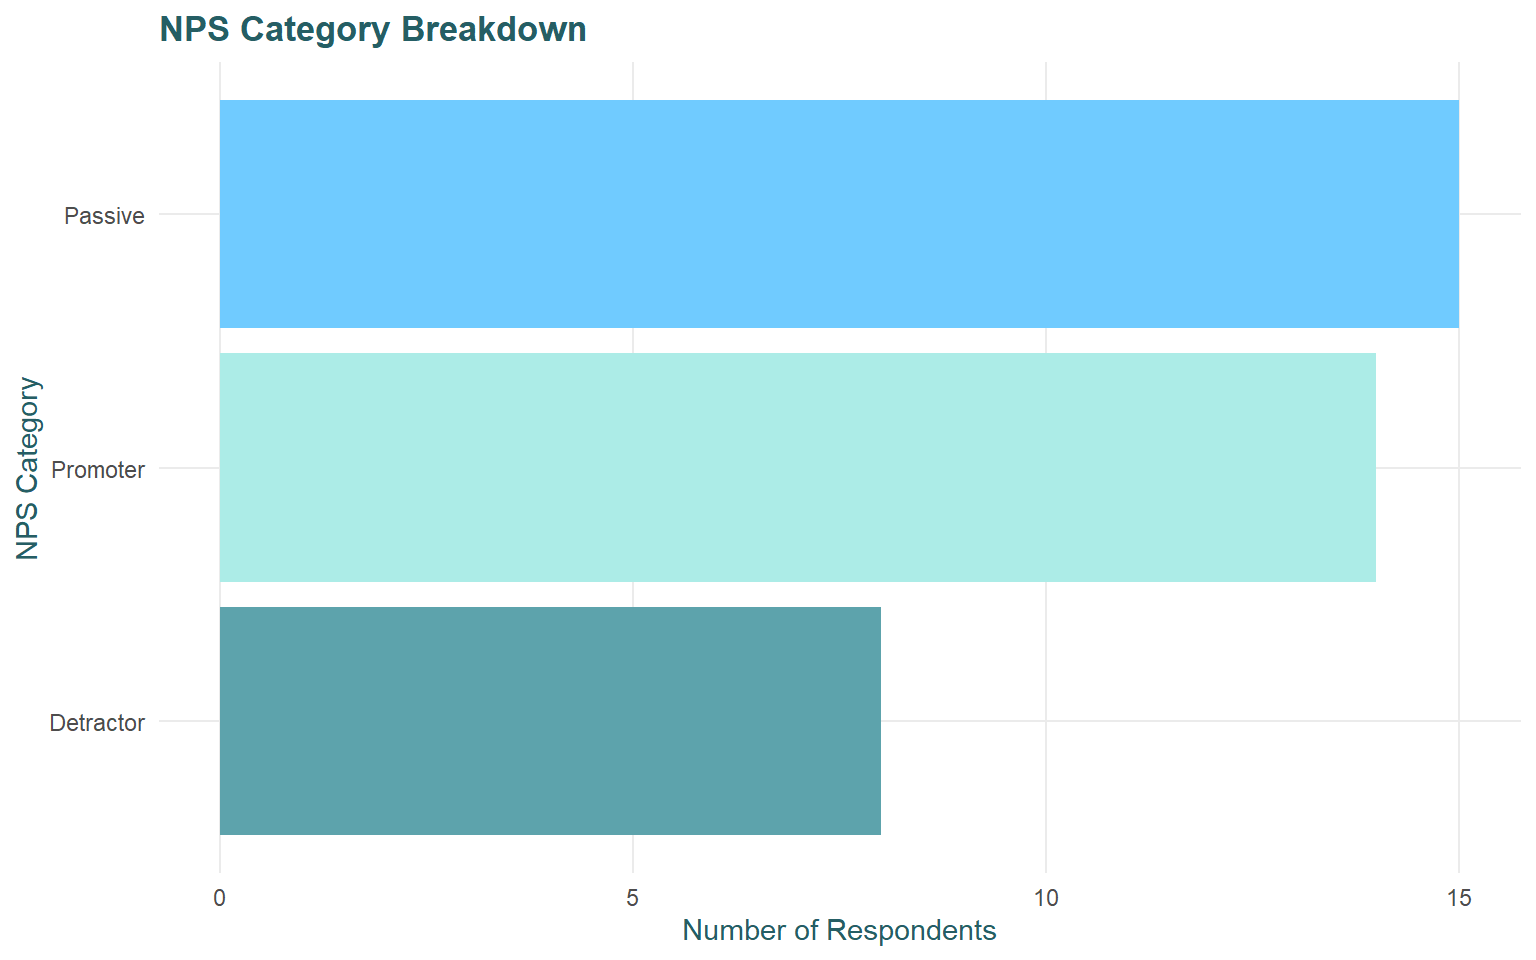
NPS Category Breakdown
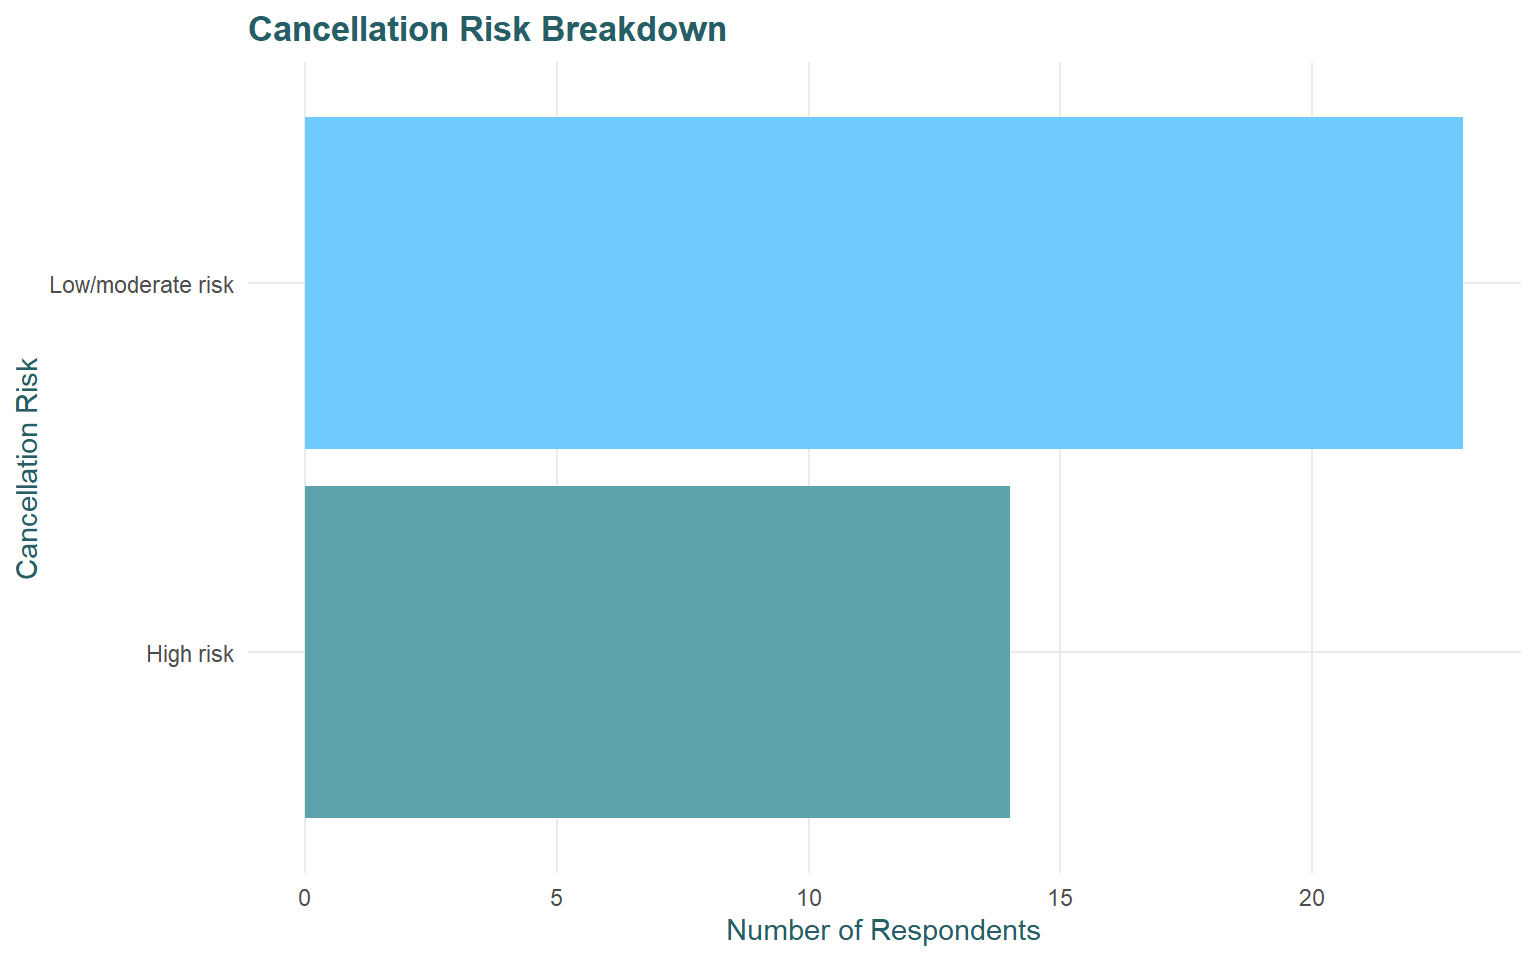
Cancellation Risk Breakdown
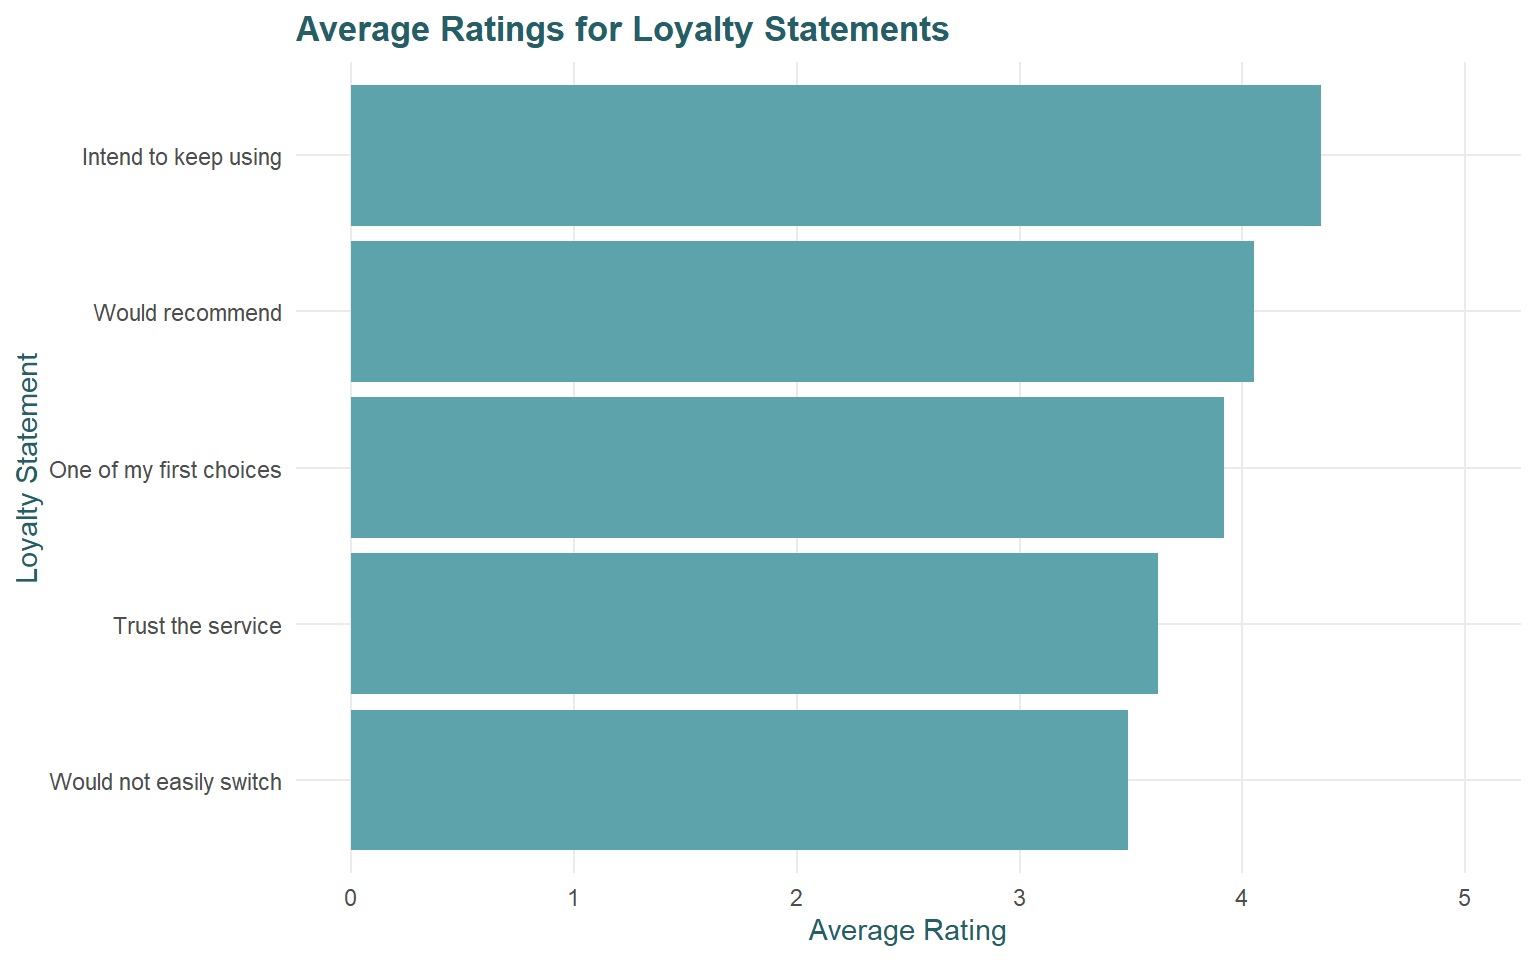
Average Ratings for Loyalty Statements
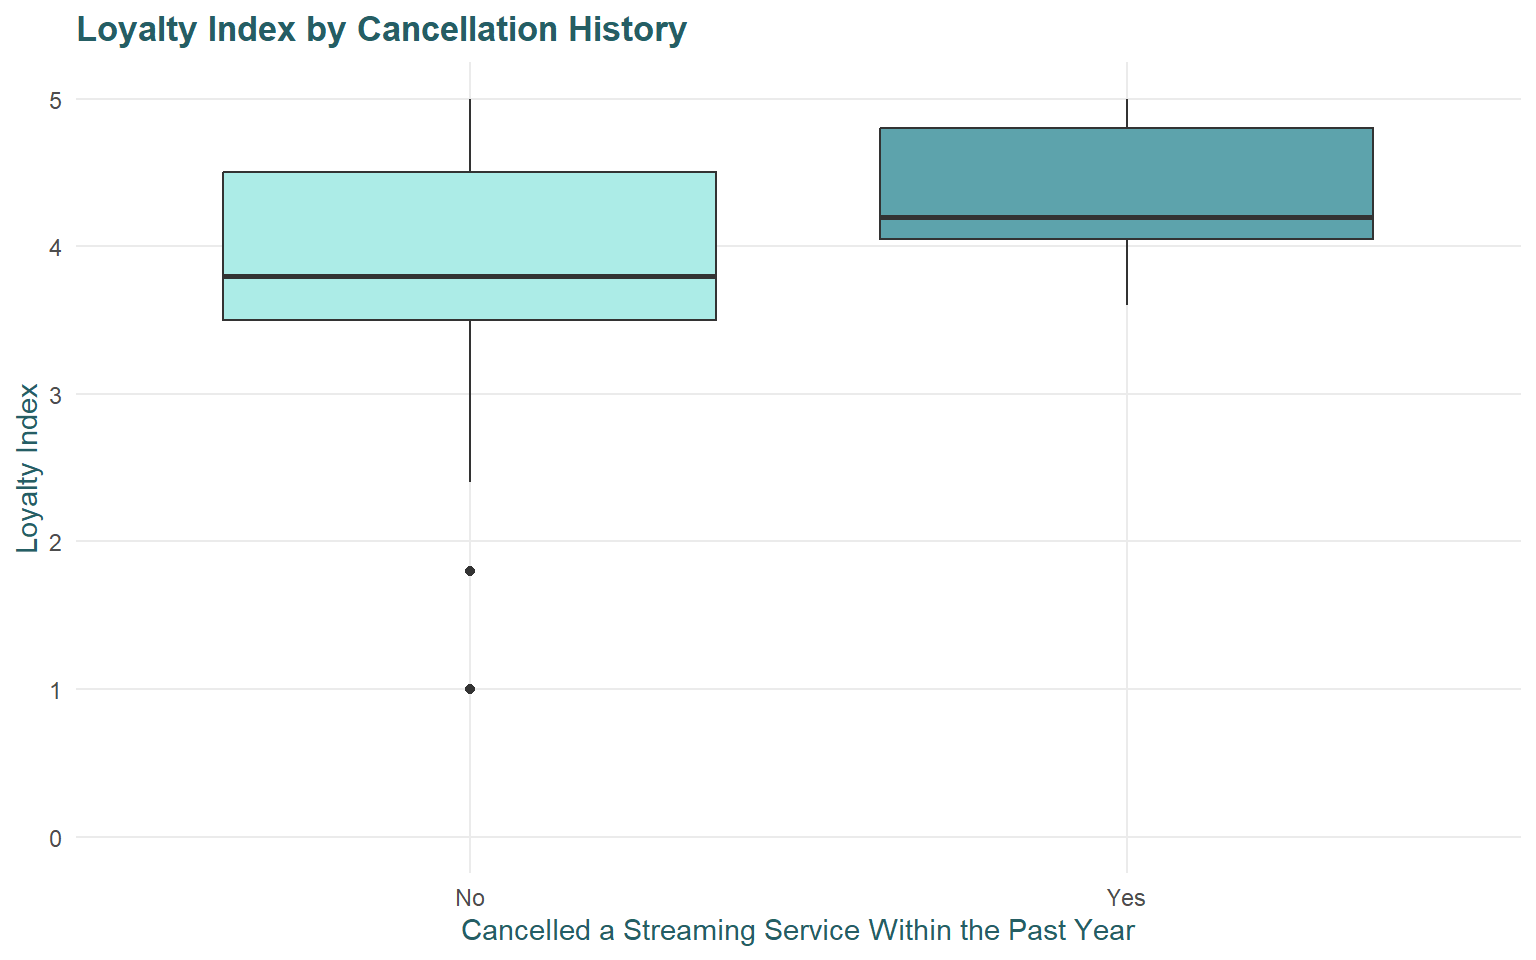
Loyalty Index by Cancellation History
Cancellation Risk by Past Cancellation
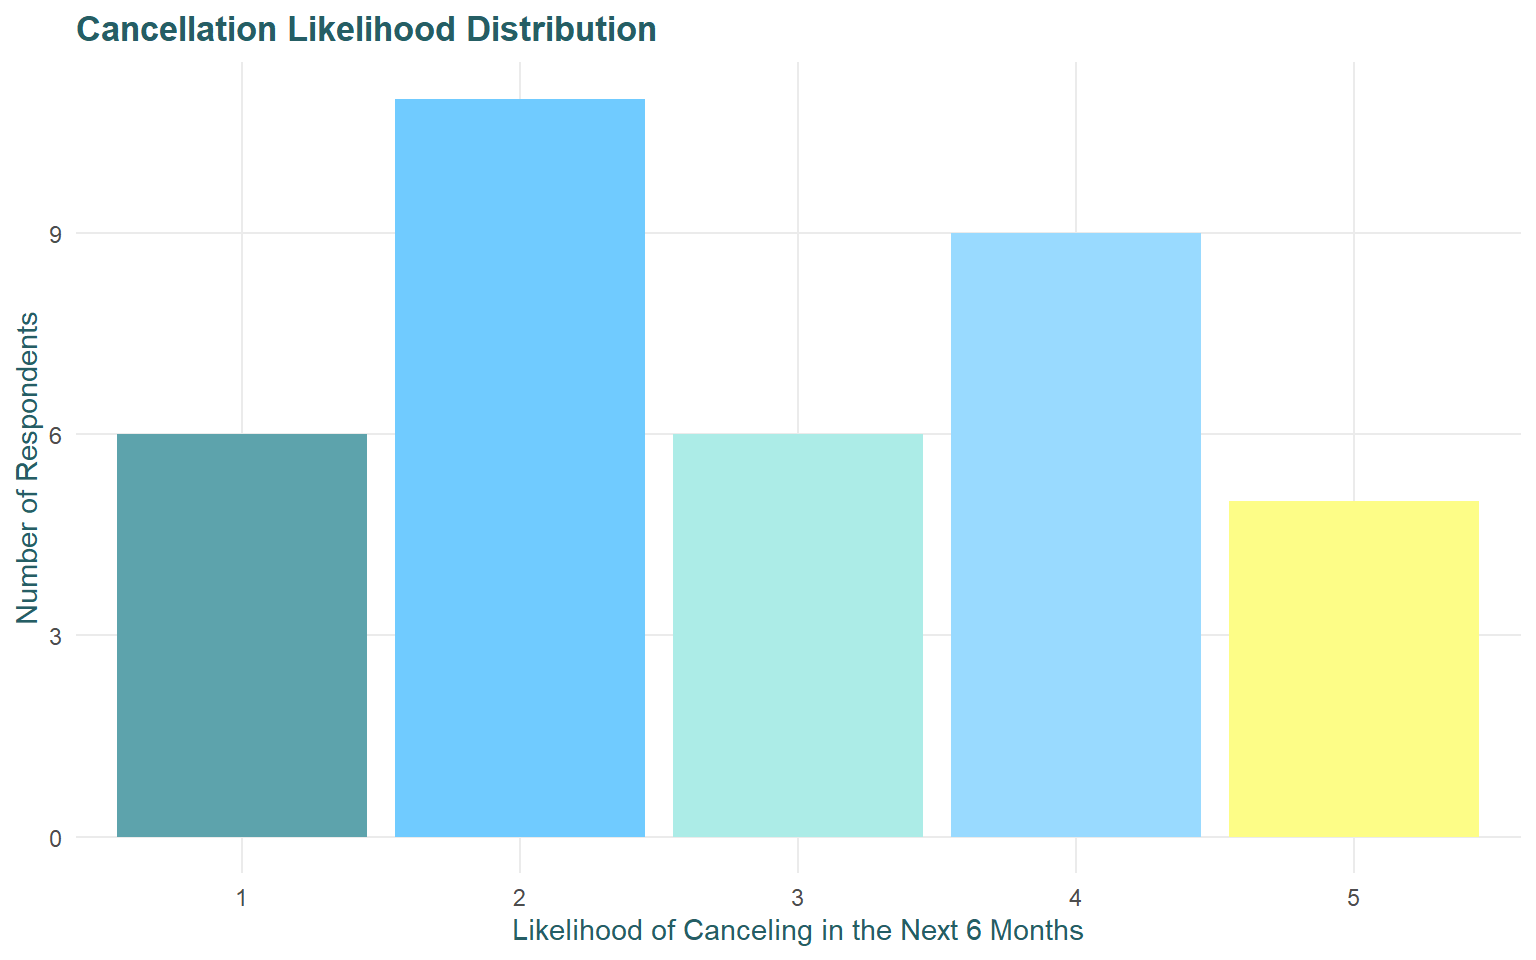
Cancellation Likelihood Distribution
This dashboard uses survey data from the Streaming Service Loyalty research project. The purpose of the dashboard is to summarize loyalty, recommendation behavior, and cancellation risk among streaming service consumers.
The dashboard focuses on key indicators such as loyalty index, NPS category, cancellation risk, and whether respondents canceled a streaming service within the past year.
Because the survey sample is small, the results should be interpreted as exploratory rather than representative of the entire streaming market.